|
|
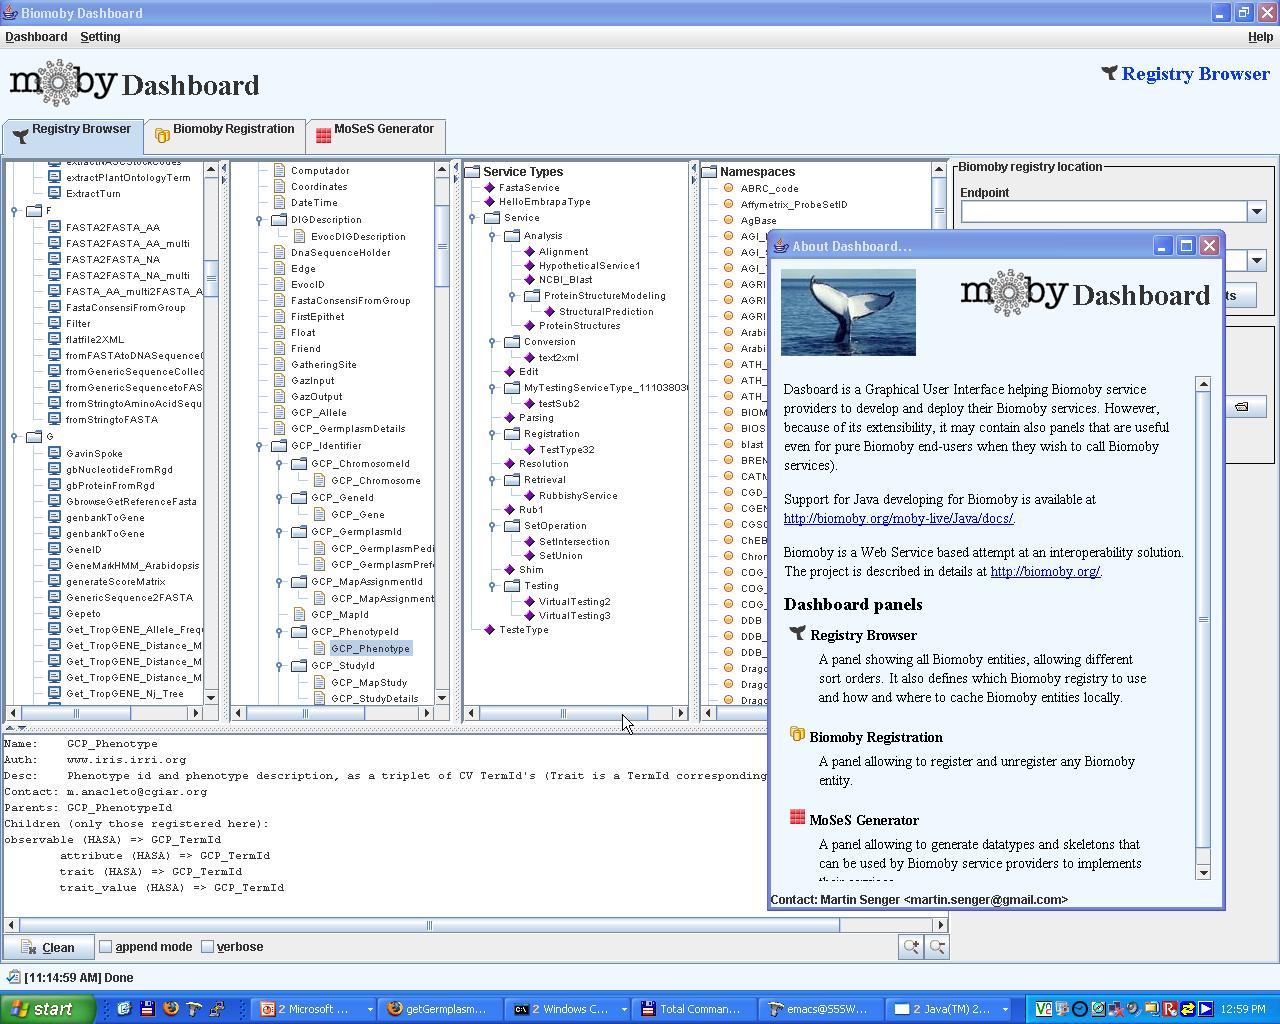
Dashboard is a Graphical User Interface helping Biomoby service providers to develop and deploy their Biomoby services. Because of its extensibility, however, it may (and I hope it will) contain also panels that are useful even for pure Biomoby end-users when they wish to call Biomoby services. One of them is the Simple Client that can call any service and has an extensible set of viewers for displaying results.
Later, you can also use the following (the reason for runing at least once the above is that it creates a dashboard configuration file - more about it below):ant dashboard
On Windows, similarlybuild/run/run-dashboard
andant dashboard
The first time, Dashboard connects to a default Biomoby registry, and fills its local cache with the Biomoby objects, and other entities. It may take few minutes, depending on the network connection. Next time, it starts almost immediately. You can (and time to time, you should), however, synchronise the local cache with the registry (there is a button Update for this purpose).build\run\run-dashboard
After started the first time, most of the fields will be empty. But once filled, the values will be remembered as your user preferences, and next time you start Dashboard, they will appear in the text fields.
Other ways how to get Dashboard are coming:
Each panel, and the Dashboard itself, has its own Help page, accessible either from the Help menu, or by pressing F1 anywhere (sorry, there is not any Back button in the help pages). This document has links to the panel help pages. Note however, that if the links (those by the panel figures below) do not work, the documentation was not built properly. If it happens in your own local installation of jMoby, just run an Ant task:
ant docs
|
From panel to panel, you can also navigate by pressing ALT-n
where "n" is a panel number (the first panel has number 1). All console windows serve as terminals - they display messages (and they are read-only, unless they have a different colour, then you can edit them, but it is rare). You can also save their contents, or copy & paste it (use the usual copy key combination CTRL-C). You can also increase and decrease their font. The verbose mode is rarely used, but you can control the append mode. Most of the lists react also on the RIGHT-CLICK with the pop-up menus. You can also copy from a list by selecting a line and CTRL-C. When using File choosers, be careful not to accidentally rename files (this cannot happen when using Java 1.5 and above). Your user preferences (the last entered values) are stored in files. On Unix, in your home directory under a sub-directory .java, on Windows in the Registry, on Mac I don't know. If some remembered values bother you (e.g. they are too long), you can always find them in the preferences and remove them manually (but there is a plan to have this function available from Setting). The sub-panels are often divided by a divider and can be re-sized by dragging the divider. You can drag the divider to any position as long as neither contained component goes below its minimum size. This is not the case with the two small arrows that appear on the divider - they let you collapse (and then expand) either of the components with a single click completely.
|
|
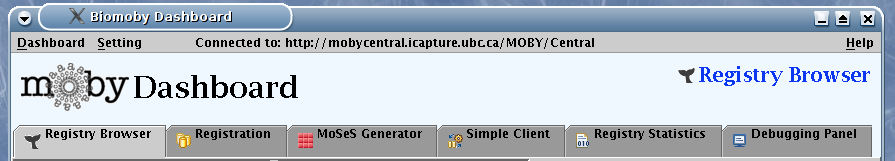
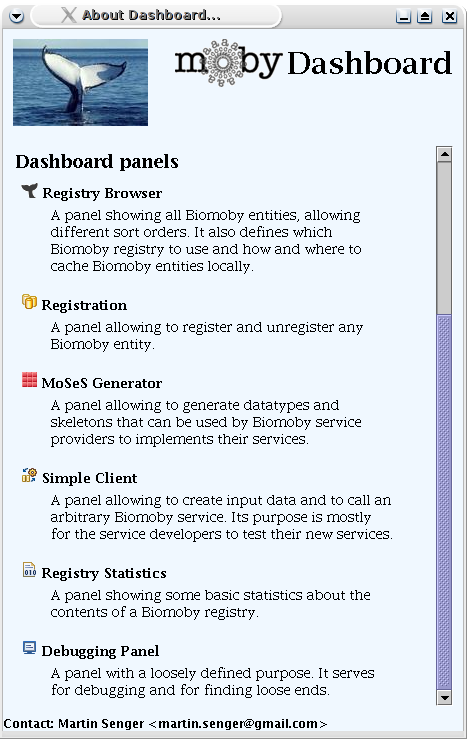
Registry Browser panel
|
Registration panel
|
|
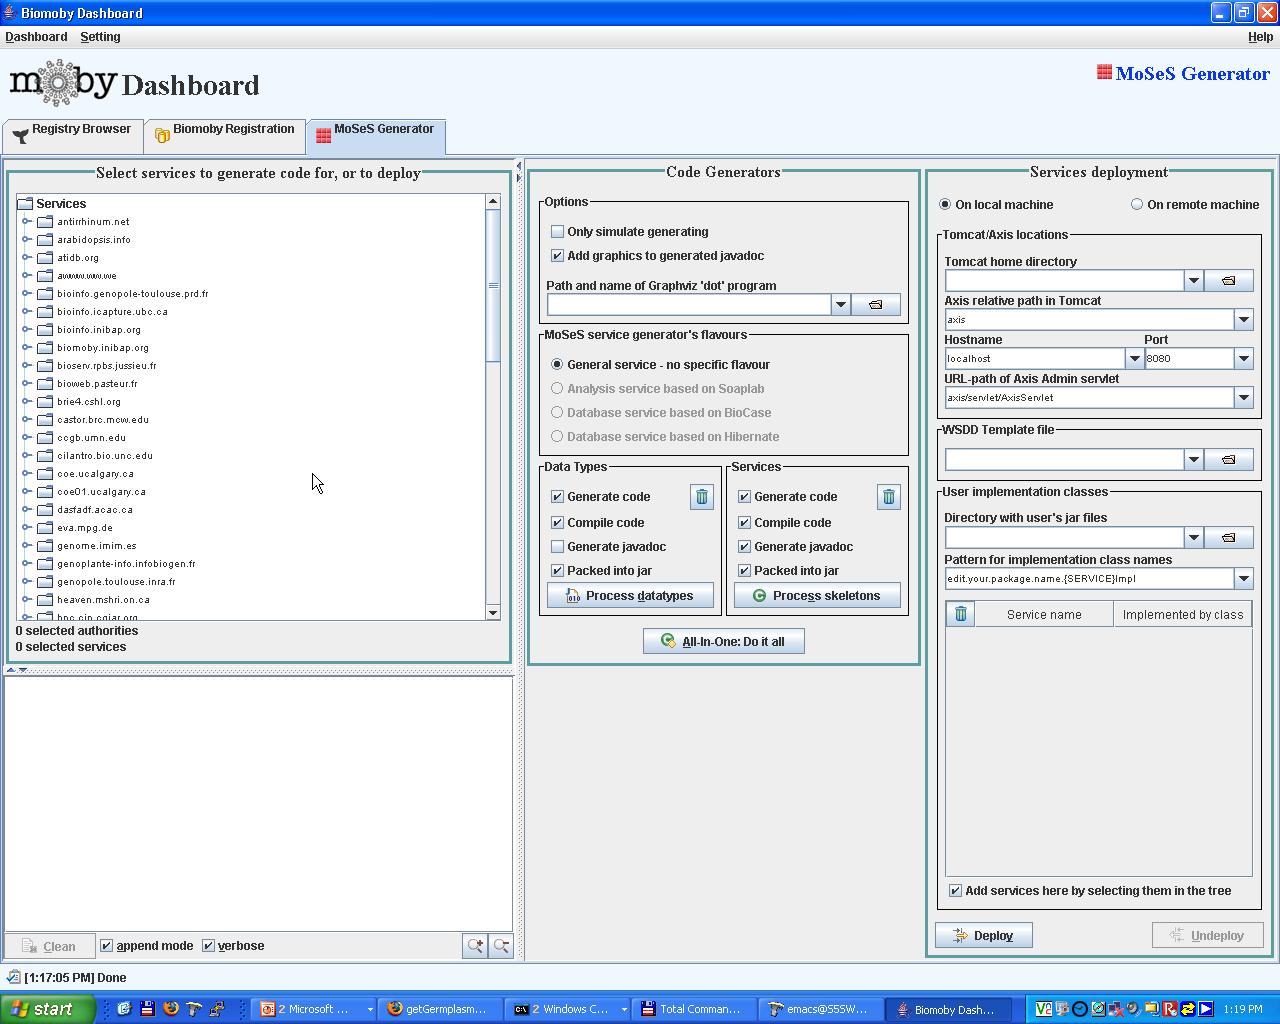
MoSeS Generator panel
|
Simple Client panel
|
|
Registry Statistics panel
|
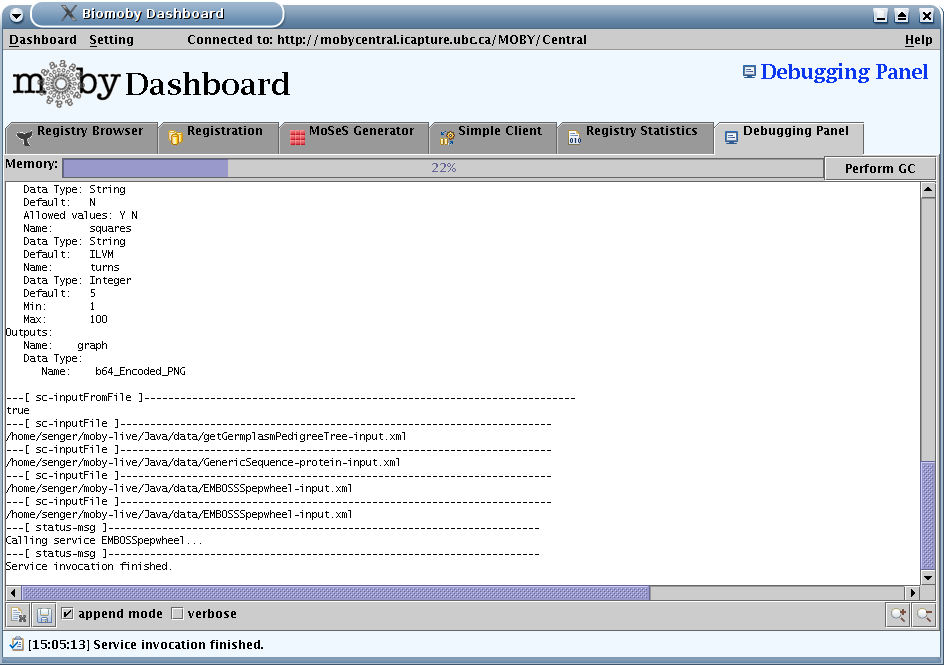
Debugging panel
|
if you now want only to have the official BioMoby central and its test repository:#dashboard.wanted.registries = default,Calgary,INB,IRRI,testing
after that just start dashboard again with ant dashboarddashboard.wanted.registries = default,Calgary,testing
IMPORTANT: We do not encourage people to set up their own repository as every can use the official BioMoby central repository. But if in any case you have to set up an own repository this explains how to make it visible in Dashboard.
The easiest way is to type the URL and the URI in the Endpoint and Namespace (URI) input fields in Dashboard, respectively. Dashboard does remember your inputs and you can select your entries later again.If you want to have it as an entry in the dropdown box you have to edit the moby-live/Java/src/org/biomoby/registry/meta/RegistriesList.java file and add there your repository based on the template of the others. This should be only done if you know what you are doing !
After that you should add the name of your repository also to the dashboard.wanted.registries property inside the moby-live/Java/src/config/dashboard/dashboard.properties.
 ). But still it is the best place to see what is "under
the hood" and what is coming...
). But still it is the best place to see what is "under
the hood" and what is coming...
 Sometimes (but not often) when Dashboard starts, it displays an error
message about a NullPointerException somewhere in the MetalUI
interface. It continues to work fine but it is annoying... (Anybody
would help to fix this?)
Sometimes (but not often) when Dashboard starts, it displays an error
message about a NullPointerException somewhere in the MetalUI
interface. It continues to work fine but it is annoying... (Anybody
would help to fix this?)
The tree that builds new data type (in Registration panel, under Data
Type registration sub-panel) sometimes does not pain itself properly
and needs to be refreshed.
Sometimes, I had problems with the Statistics Panel when a
list of services was re-loaded. I think I fixed it, but one never
knows... Please let me know if you witness anything strange.
|
There are no stupid
questions, there may be only stupid answers... Tulak
|
 Dashboard starts empty - no panels there...
The reason is that the Ant creates a Dashboard configuration file (dashboard-config.jar) which defines what panels to include (and other things, such as Dashboard title). Details about configuration are in a separate document.ant dashboard
Where are the user preferences stored?
On Windows in Registry: HKEY_CURRENT_USER/Software/JavaSoft/Prefs/org/biomoby/services/dashboard.
On Mac: I don't know...
Some viewers in the SimpleClient panel were inspired, sometimes highly inspired, by similar viewers in Taverna.
Most of the icons were shamelessly stolen from the open-source project Eclipse.